Introduction
 In this lab, we will be looking at the principals of diffusion which is defined as the movement of molecules from a high solute concentration to a low solute concentration. Several factors affect the rate of diffusion. The first is temperature. The warmer the temperature is, the faster molecules move. Consequently, as temperature increases, as does the rate at which molecules can diffuse. In addition, the more concentrated something is, the quicker it diffuses. Therefore, the concentration gradient directly affects the rate of diffusion. Third, if a molecule has to cross a membrane, membrane permeability effects the rate of diffusion. The more permeable a membrane is, the faster the rate of diffusion. We will simulate this by putting urea channels into a otherwise impermeable membrane.
Molecular size also effects the rate of diffusion. The smaller the molecule, the faster the rate. If you look at the graph to the right, you can see the rates of diffusion of sodium ions, which have a mass of 23 Daltons, vs dextrose molecules that have a mass of 180 Daltons. As you can see, the rate sodium ions increased greatly.
When you click on the tabs, the experimental apparatus pictured below will be displayed and start automatically. It consists of 2 tanks filled with water and a bridge between it. An impermeable membrane (part 1) can be added as well as the membrane with urea channels (part 2). However, for the last 6 runs all the molecules will be able to diffuse from the left to the right. Two different molecules will be placed in the left had tank at the start of each run. The first is urea which is represented by a green dot. Urea has a molecular mass of 60 Daltons and will be our small molecule. The other molecule is glucose and it is represented by an orange hexagon. Glucose has a molecular mass 180 Daltons so in theory, it will be 3 times slower.
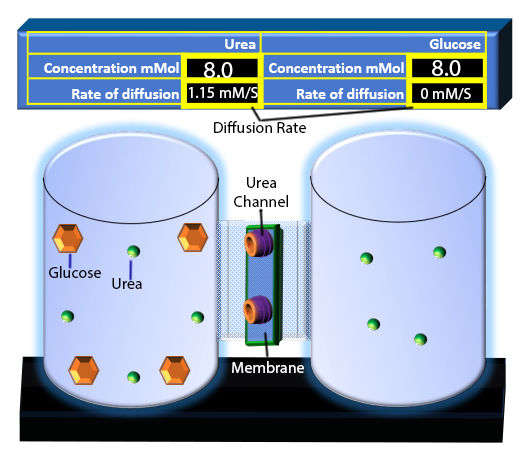
The initial concentrations and rates of diffusion are displayed in the bar on top of the apparatus. Please watch all 8 animations.