Read the introduction. Then click on each of the activities.
Introduction
We will be recreating 2 activities in your lab book (found on P 101) that are normally done in class. In these activities, you will be looking at EKG waves for lead 2. The waves are caused by the sum of the electrical activity of the heart moving either towards the annode or cathode.
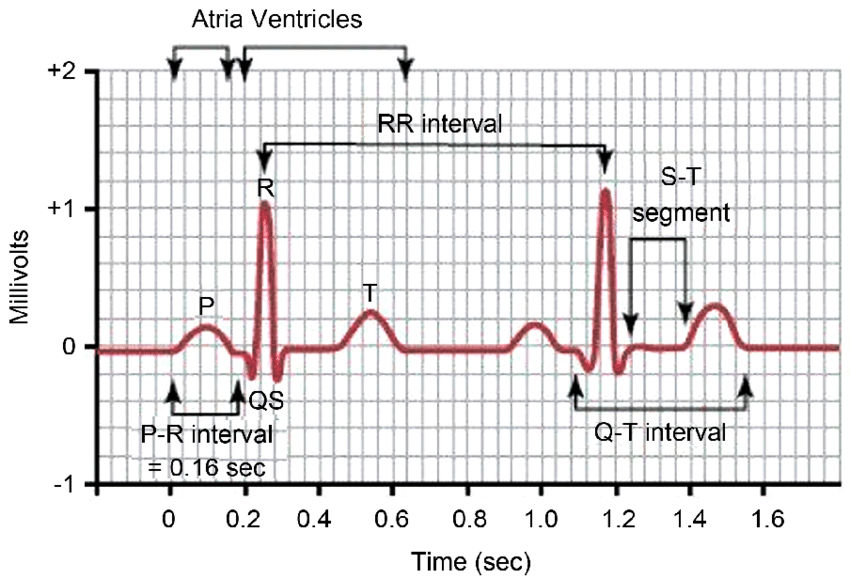
Each wave is a different part of the cardiac cycle. The P wave represents depolarization of the atria. During the interval between the P wave and QRS complex, which is called the P-R interval, the atria are contracting. The QRS complex is the path of the current through the AV Bundle and to the purkinje fibers. The interval between the S and the T waves is called the S-T segment and the ventricles are contracting. Finally, the T wave represents repolarization of the ventricles. The bottom of the EKG gives you time. Therefore, you can determine the heart rate. Typically you go from R wave to R wave. On this EKG, the time was 1 second between R waves. So 1 contraction/1S = X contractions/60 S ' 60 contractions per 60 seconds).
You can also see diastole and systole of the ventricles (or atria) from the EKG. As mentioned above, the P-R interval is atrial systole and the S-T interval is ventricular systole. Therefore, we can measure how long the heart is actually contracting for. The T-P interval is when the heart is completely at rest (aka electrically silent). Lastly, the T-R interval is ventricular diastole.
The figure to the left shows a typical EKG. The bumps that you see correspond to current moving through the heart. The magnitude is recorded in the Y axis and the x-axis records time. By measuring in between the same waves of successive heart beats, we can measure heart rate. For example, each of the boxes above measures out 0.04 sec. There are 23 boxes in the R-R interval, thus 23*.04 = 0.92 sec/beat. So, flipping that ratio, 1 beat/0.92sec *60sec/min = 65BPM
This page is meant to give you the readouts you would have made in class for the begining of lab 16. Click on the 2 tabs to the left to get the data for part 1 of the lab.
Observing the affects of breathing on heart rate
We will be calculating the heart rate for three conditions and filling out table 1 on page 101. Typically heart rate is measured from the R wave to the R wave for a set amount of time then converted to beats per minute. You count the number of beats (R wave to R wave) in a set number of seconds them multiplying it by 60 beats/min. So if you count stop the EKG when it starts, we can see the first 2 beats and it took 1.2 seconds. So I take the ration 2 beats/1.2 seconds and multiply it by 60 seconds/1 minute and get 100 beats per min (a tad fast).
When you inhale and hold your breath, your heart rate goes up while when you do a deep exhale it goes down. So you will measure the number of beats in 2 seconds for both the inhalation and the exhalation. The author of the animation forgot the normal breathing. I would use the two breaths between 8.4 and 10 seconds for the normal.
Calculate the normal heart rate, the heart rate during inhalation, and the heart rate during exhalation and record it on P 101.
The animation will start automatically and repeat every 14 seconds. I suggest clicking on full screen mode (the 4 arrows pointing to the 4 corners of the screen). You can stop the animation at any point by pressing the pause button. Then click on it and slide it left and right to get to specific parts.
Measuring the time between waves
For this activity, you will be measuring the length of different intervals on the EKG wave. Normally you would have a computer to highlight the waves/intervals. However, you will have to do it the old fashion wave of counting grid spaces and adding them up. Each small square is 0.04 seconds and the large (red) squares are .2 seconds.
Measure each of the waves and intervals indicated on P 101 by counting the number of small grids. For instance, is 2 small squares. Since each small square is 0.04 seconds, the P wave would be 0.8 seconds.
The EKG readout will start automatically. I suggest going to full screen mode (the for arrows pointing to the 4 corners). You can stop by pressing the stop icon and move let and right by either clicking and dragging your mouse or the arrows.